


Rollover resistance in a golf cart comes down to two numbers: track width and center of gravity height. Their ratio, the static stability factor, says more about the vehicle than any trim option on the spec sheet.
Why color fades and center of gravity doesn’t
Every cosmetic choice on a golf cart can be changed later; where the mass sits cannot.
A body color, a wheel style, a stitched seat, a chrome badge — all of these are reversible decisions. You can repaint a cart, swap wheels, or reupholster a bench in a weekend. The height of the center of gravity is designed into the vehicle the day the frame is welded, and it stays with the cart for its entire service life.
This is not a marketing opinion. When NHTSA studied rollover resistance, it concluded that center of gravity height, track width, and the lateral force the tires can generate are the dominant factors, while suspension geometry and component stiffness are of secondary importance. [1] In other words, the things buyers photograph at a dealership are not the things that keep a cart on its wheels.
A golf cart makes this unusually visible. The vehicle is short, narrow and tall relative to a passenger car, it carries up to four people above the axle line, and it is often driven on turf, gravel, or an off-camber path where lateral forces build quickly at low speed. Under those conditions, ten centimeters of mass placement matters more than ten color options.
The one formula worth memorizing
Static stability factor is half the track width divided by center of gravity height, and it approximates the lateral acceleration — in g — at which a rigid vehicle starts to tip.
The formula is simple: SSF = T / 2H.
T is track width, measured center-to-center between left and right tires. H is the height of the vehicle’s center of gravity above the ground. NHTSA uses this ratio as the basis of its rollover ratings, and publishes reference ranges: passenger cars typically sit between 1.30 and 1.50, while higher-riding SUVs, pickups and vans fall between 1.00 and 1.30. [2]
Golf carts sit below that band. Using benchmark values that are typical of this vehicle class — a 1.0 m (39.4 in) track and a center of gravity around 0.55 m (21.7 in) — the stability factor lands near 0.91. That is an engineering estimate, not a measured value, but the implication is straightforward: this class of vehicle reaches its tipping threshold before it reaches 1 g of lateral acceleration.
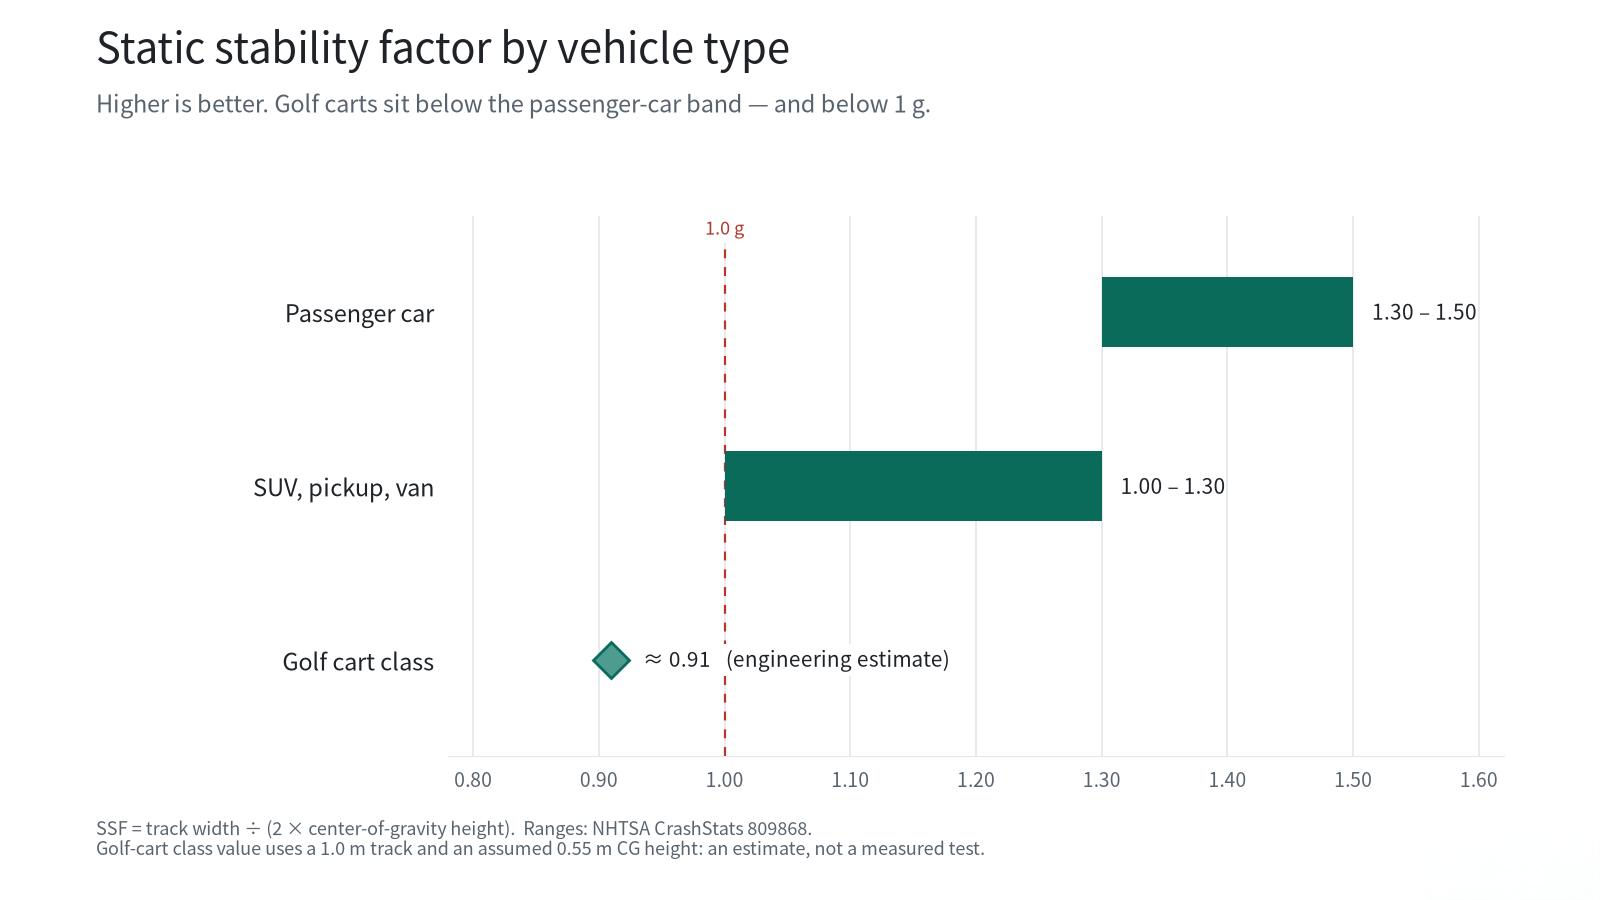
Translated into driving: on a 5 m radius turn, 0.91 g corresponds to roughly 24 km/h (15 mph); on a 10 m radius, roughly 34 km/h (21 mph). A cart rated to 30 km/h can therefore approach its lateral limit inside a parking loop — which is why rollover incidents cluster around turns, ramps and side slopes rather than top speed.
Battery height is not center of gravity height
Lowering a battery pack by 20 cm moves the vehicle’s center of gravity by only 2 to 12 cm, because the pack is only part of the total mass.
This distinction matters, because it is where honest engineering and marketing language diverge. A battery mounted 40 cm (15.7 in) above the ground instead of 60 cm (23.6 in) is genuinely better — but the gain has to be weighted by mass:
The pack’s share of total vehicle mass decides the outcome, and that share differs enormously by chemistry. Lead-acid packs commonly account for 50 to 60 percent of a cart’s mass, so a 20 cm drop moves the center of gravity by 10 to 12 cm. Lithium packs usually represent 10 to 20 percent, so the same 20 cm drop yields 2 to 4 cm. Both are real improvements; only one of them transforms the vehicle.
| Pack share of vehicle mass | CG drop from 20 cm lower pack | CG height | Static stability factor |
| 10% (typical lithium) | 2 cm (0.8 in) | 0.53 m | ≈ 0.94 |
| 20% (heavy lithium) | 4 cm (1.6 in) | 0.51 m | ≈ 0.98 |
| 50% (lead-acid) | 10 cm (3.9 in) | 0.45 m | ≈ 1.11 |
| 60% (lead-acid, heavy) | 12 cm (4.7 in) | 0.43 m | ≈ 1.16 |
WINTAO mounts its packs 40 cm (15.7 in) above ground, against a class benchmark of 60 cm (23.6 in) — a 20 cm difference based on WINTAO engineering data. The figures above show what that difference is worth rather than asserting what it is worth.
Frame stiffness: what 18.8 kg actually buys
A frame built from 50×70 mm tube with 3 mm walls weighs about 18.8 kg (41 lb) more than a 40×60 mm, 2 mm frame over the same 8 m of steel — and carries roughly 2.6 times the torsional stiffness.
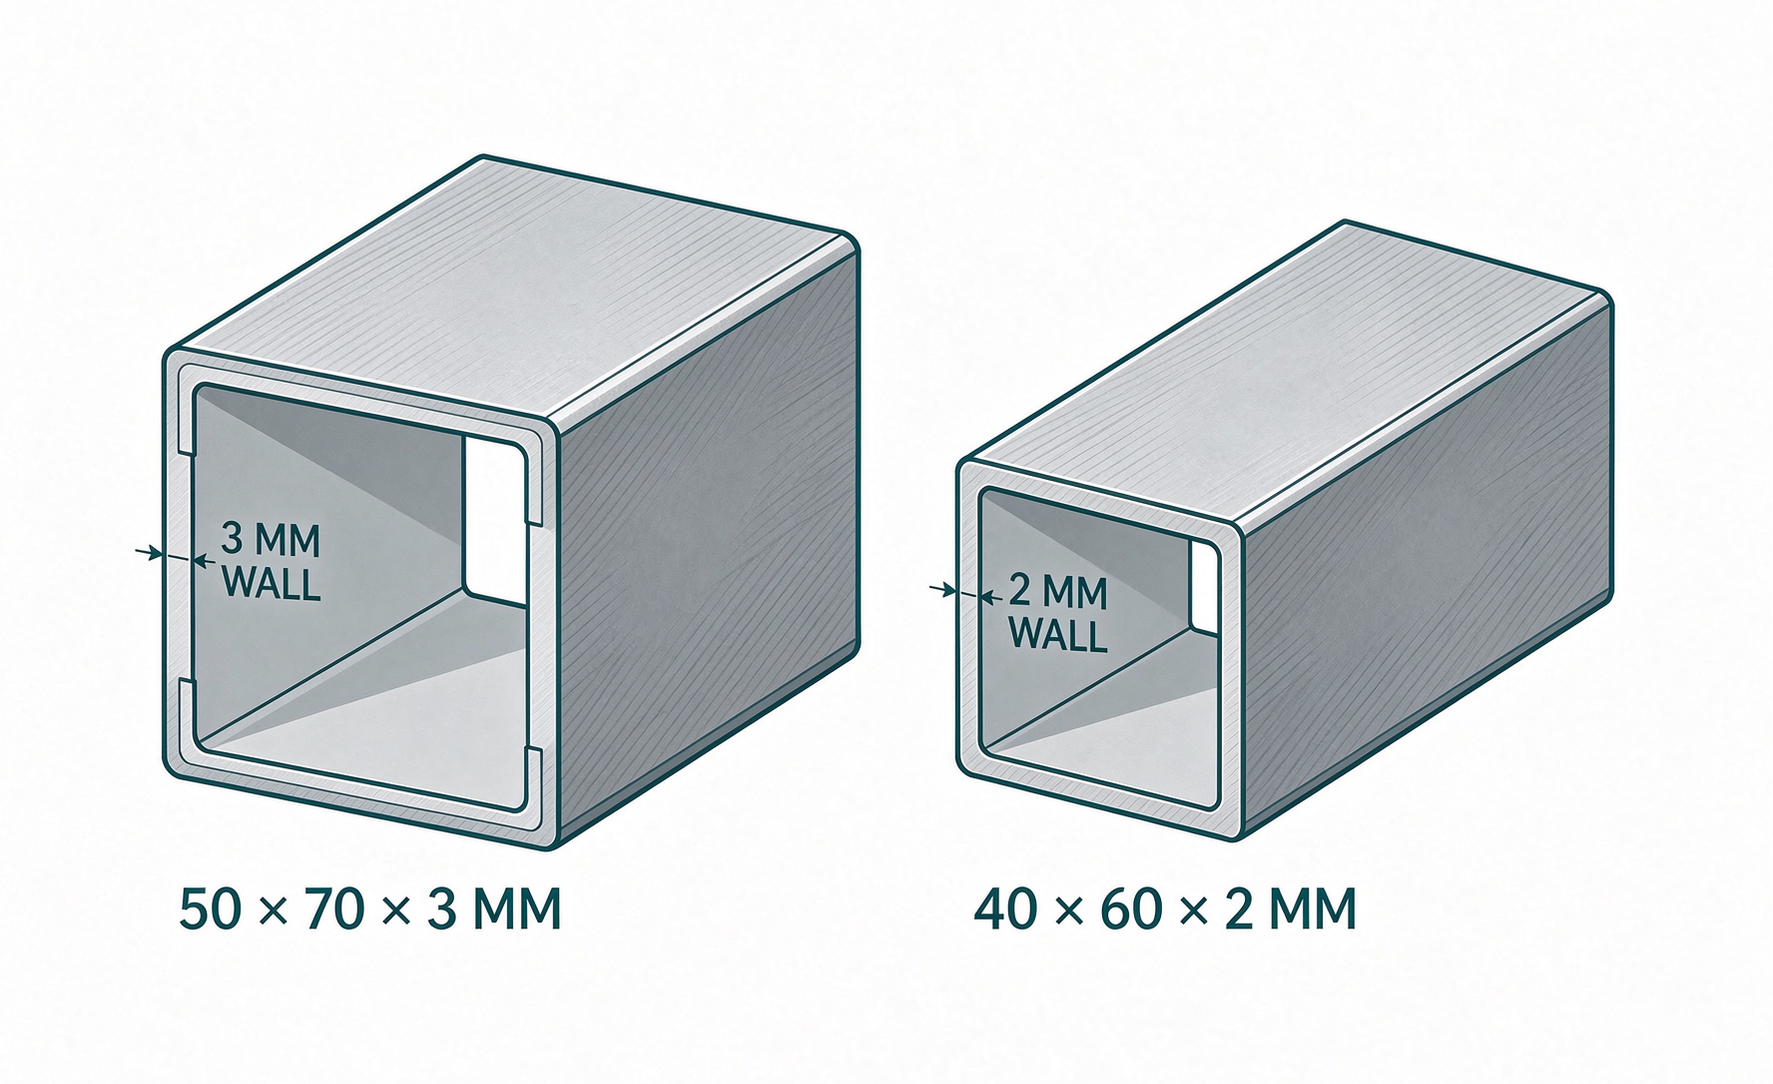
Section properties, calculated for the two tubes:
| 50×70×3 mm | 40×60×2 mm | |
| Section area | 684 mm² | 384 mm² |
| Mass per meter | 5.37 kg/m (3.61 lb/ft) | 3.01 kg/m (2.03 lb/ft) |
| 8 m of tube | 43.0 kg (95 lb) | 24.1 kg (53 lb) |
| Torsion constant J | 521,900 mm⁴ | 202,400 mm⁴ |
| Bending inertia I | 274,852 mm⁴ | 102,272 mm⁴ |
| Torsional section modulus | 18,894 mm³ | 8,816 mm³ |
The torsion constant follows the thin-walled closed-section relationship, where A₀ is the area enclosed by the tube’s midline and the denominator sums each wall length divided by its thickness:
Thicker walls do two things at once. They raise torsional stiffness — 2.6 times here — and they resist local buckling and weld distortion at the joints, which is where a light frame usually fails first. The cost is real and worth stating plainly: 18.8 kg of extra mass, a little more energy per kilometer, and more material cost. On a 400 kg class vehicle that increment is a few percent of total mass, and the engineering judgement is that torsional stiffness and joint durability are worth it — a flexing frame also lets the body twist, which changes steering feel and roof alignment over time.
These are section-property calculations, not rig measurements. Whole-frame stiffness also depends on joint design, cross-member layout and weld quality, and a real comparison requires a torsion rig or an FEA model.
Load, not paint, is the real multiplier
With 350 kg of passengers aboard, the same cart’s stability factor falls from about 0.91 to about 0.71 — a 22 percent loss from loading alone.
Class benchmark axle distribution in these vehicles runs roughly 20:80 front to rear, which places the center of gravity close to the rear axle. That bias is deliberate: it loads the driven axle and helps traction on turf and gravel. It also means the front axle carries little weight, so adding passengers and cargo changes steering response and brake balance more than drivers expect.
Four adults seated above the axle line raise the combined center of gravity from roughly 0.55 m to 0.70 m. That single change does more to the vehicle’s stability than any styling package ever will, and it happens every Saturday morning on the first tee.
Five questions to ask before you buy
Buyers who want to evaluate this properly should ask for five numbers, and should be skeptical of a dealer who cannot supply any of them.
-
- What is the measured center of gravity height, in the loaded condition you intend to use?
- What are the front and rear track widths?
- Has the cart been through a tilt-table test, and what side-slope is it rated for?
- What is the frame tube section and wall thickness — and does that figure cover cross members or main rails only?
- What does the roof structure weigh, and how stiff is it at the pillar base?
Key takeaways
-
- Static stability factor for this vehicle class lands near 0.91, against 1.30–1.50 for passenger cars — the tipping threshold is reached before 1 g of lateral acceleration.
-
- A battery mounted 20 cm lower lowers the vehicle’s center of gravity by 2 to 12 cm, depending on whether the pack is lithium or lead-acid.
-
- A heavier frame is a deliberate trade: 18.8 kg more steel over 8 m yields about 2.6 times the torsional stiffness of a lighter section.
FAQ
- Are lithium golf carts more likely to tip over than lead-acid carts?
Not because of the chemistry itself. A lithium pack weighs less, so the same 20 cm of mounting height is worth less in center-of-gravity terms, and the vehicle’s total mass drops too. The net effect depends on where the pack sits and how the suspension is tuned, which is why the mounting height matters more than the cell type.
- How steep a hill can a golf cart climb?
Climbing ability and side-slope stability are different limits. Many carts in this class quote a 20 percent grade capability, but a safe side slope is a fraction of that because gravity is already working against the vehicle laterally. Ask the manufacturer for both figures and keep well inside them on wet turf.
- Does a lift kit make a golf cart less stable?
Yes. A lift raises the frame and everything mounted on it, so the center of gravity rises by roughly the lift height. A 6 inch lift can move stability down to the level of a fully loaded, unlifted cart. Wider tires help only if they also widen the track; a taller tire raises the center of gravity again.
- Is a higher static stability factor always better?
It is a comparison tool rather than a safety certificate. A cart with a higher figure tips later in a steady turn, but real rollovers are usually tripped by a curb, a rut or a slope, where suspension travel and tire behaviour also matter. Use the number to compare vehicles, not to justify faster driving.
REFERENCE:
- Federal Register, “Safety Standard for Recreational Off-Highway Vehicles (ROVs)” — discussion of the static stability factor, loading condition and the dominant factors in rollover resistance.https://www.federalregister.gov/documents/2014/11/19/2014-26500/safety-standard-for-recreational-off-highway-vehicles-rovs
- NHTSA CrashStats, “Trends in the Static Stability Factor of Passenger Cars, Light Trucks, and Vans” (publication 809868) — SSF formula and reference ranges by vehicle type, 1.00–1.50.https://crashstats.nhtsa.dot.gov/Api/Public/ViewPublication/809868
- eCFR, 49 CFR 571.500, “Standard No. 500; Low-speed vehicles” — 40 km/h (25 mph) maximum speed limit and required equipment.https://www.ecfr.gov/current/title-49/subtitle-B/chapter-V/part-571/subpart-B/section-571.500?sub_id=goaffpro